Research foundation and living reference model · CC BY 4.0
Diagrams
All 11 diagrams from the research package, in order. Full structural specifications (what each diagram shows, evidence-class labeling, and design rules) are in the Visual Asset Briefs.
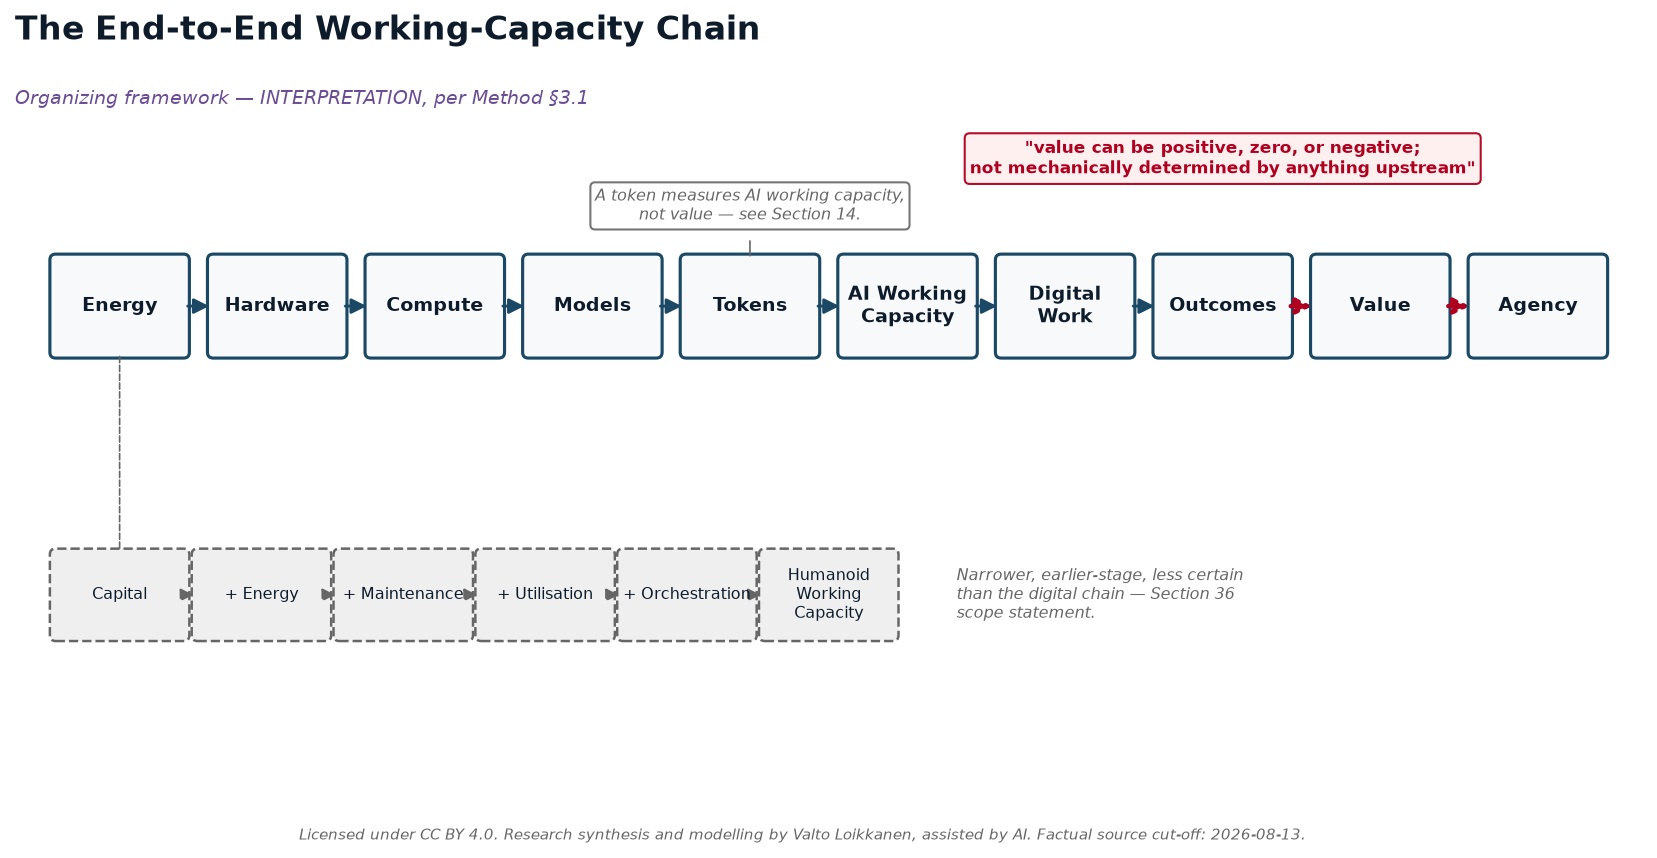
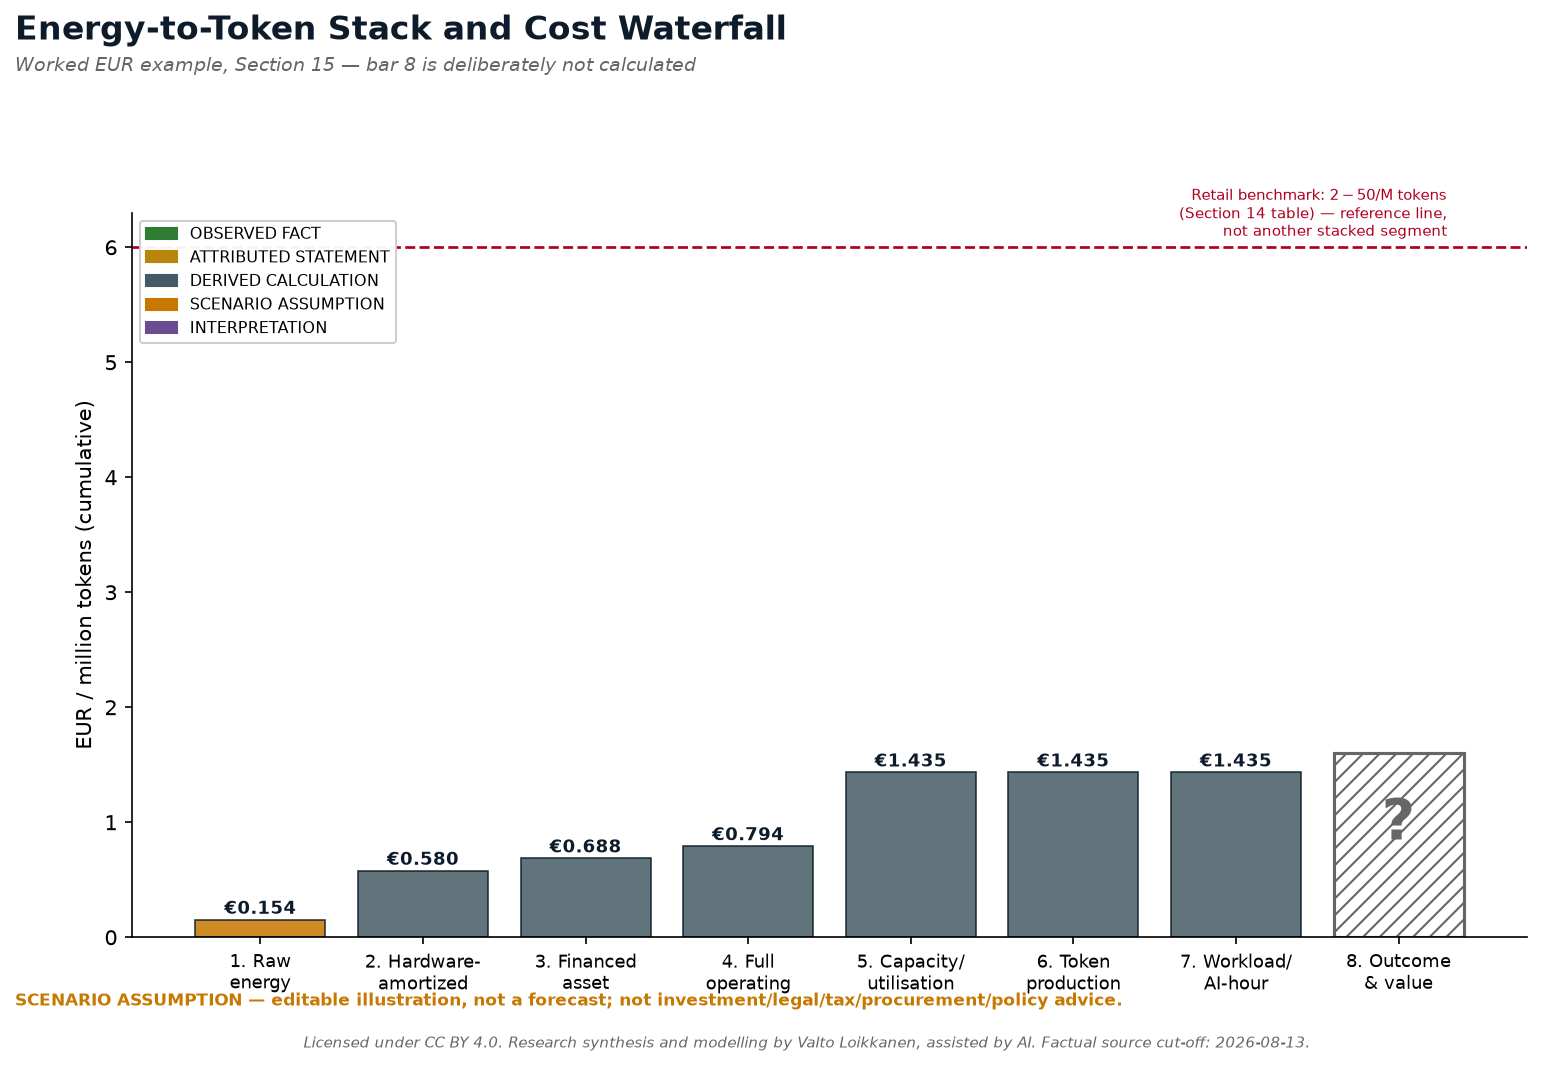
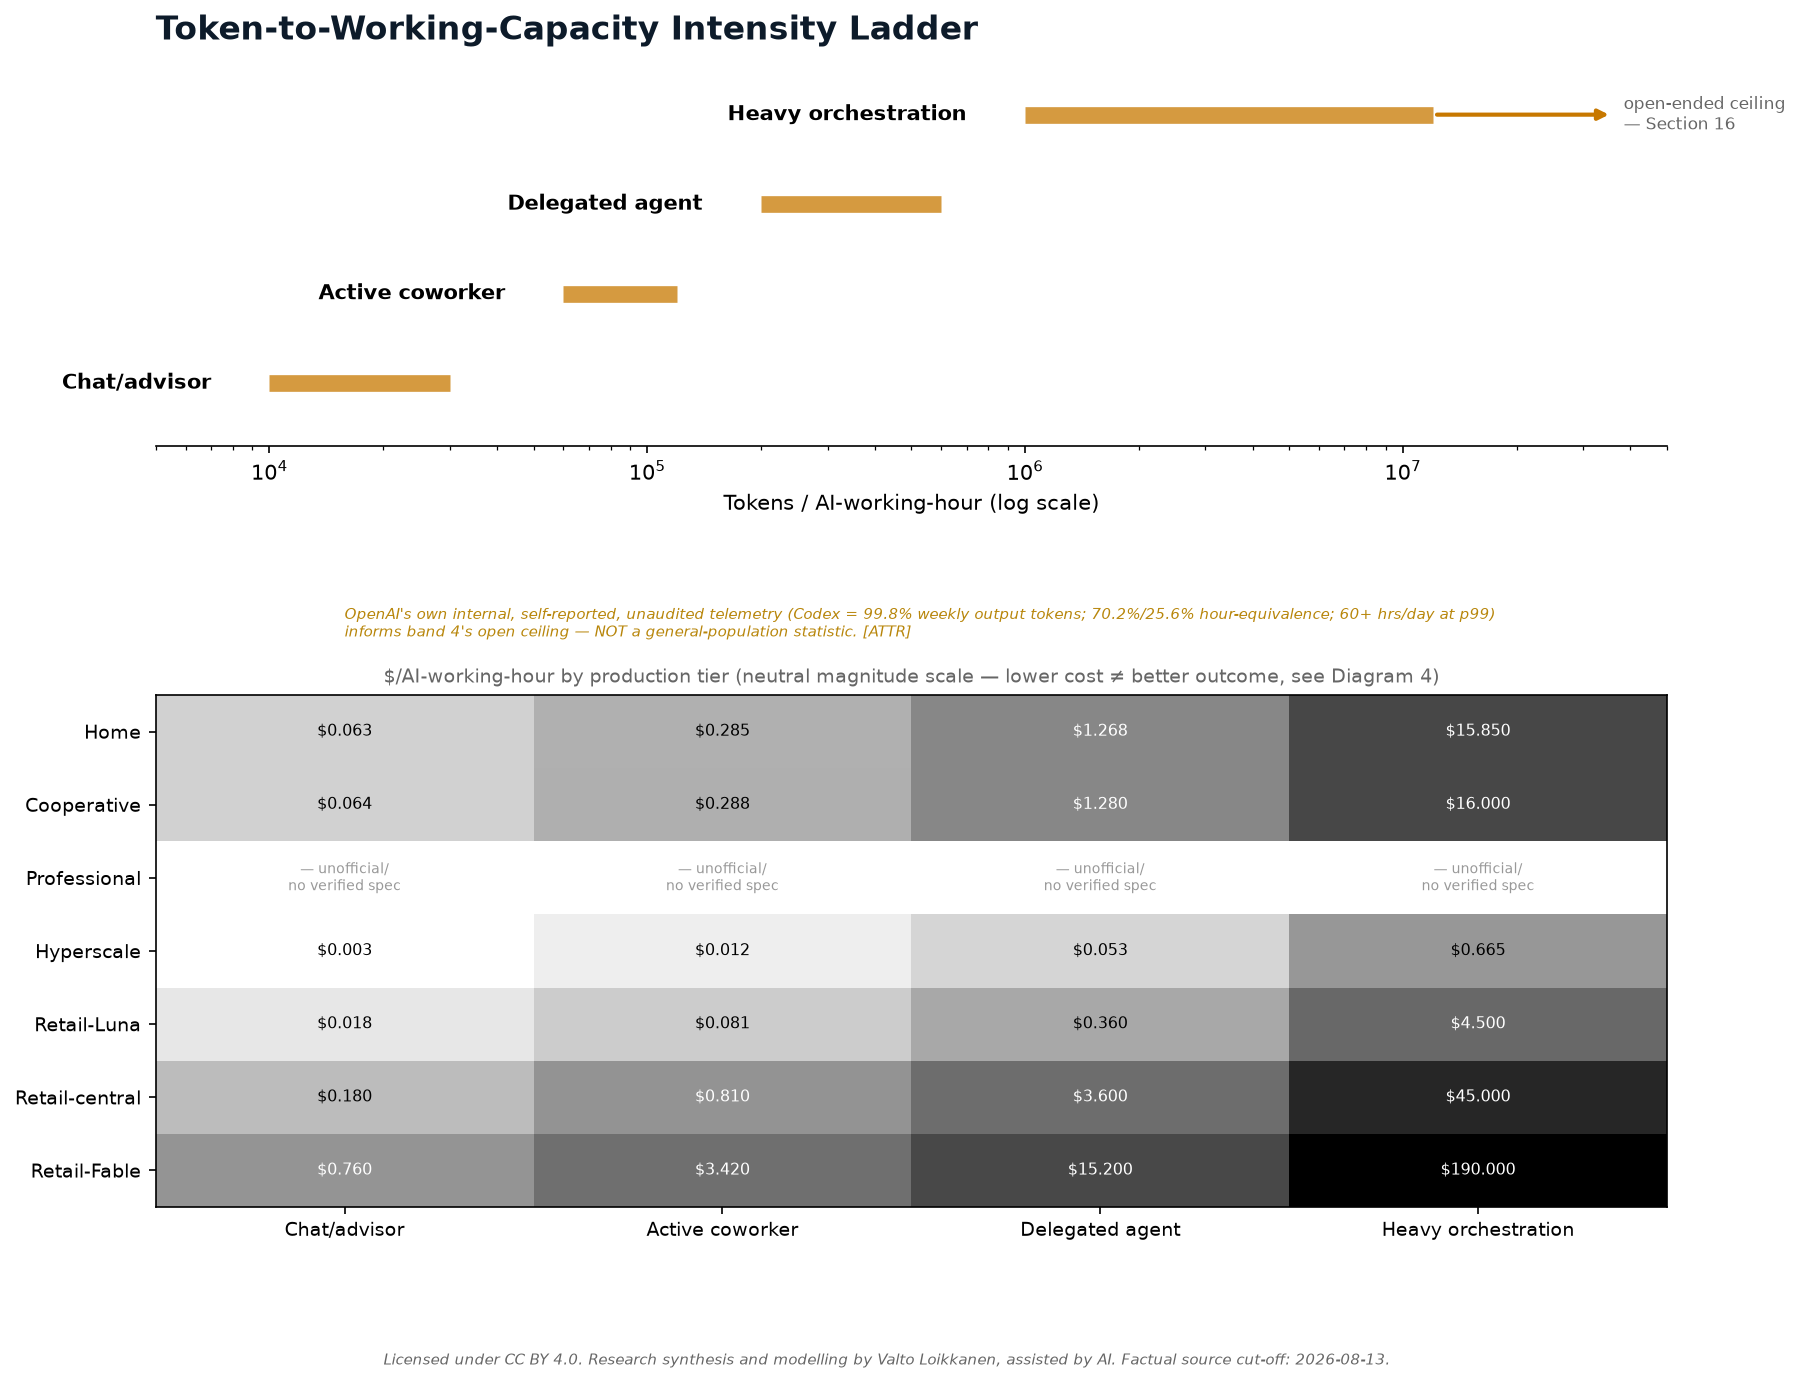
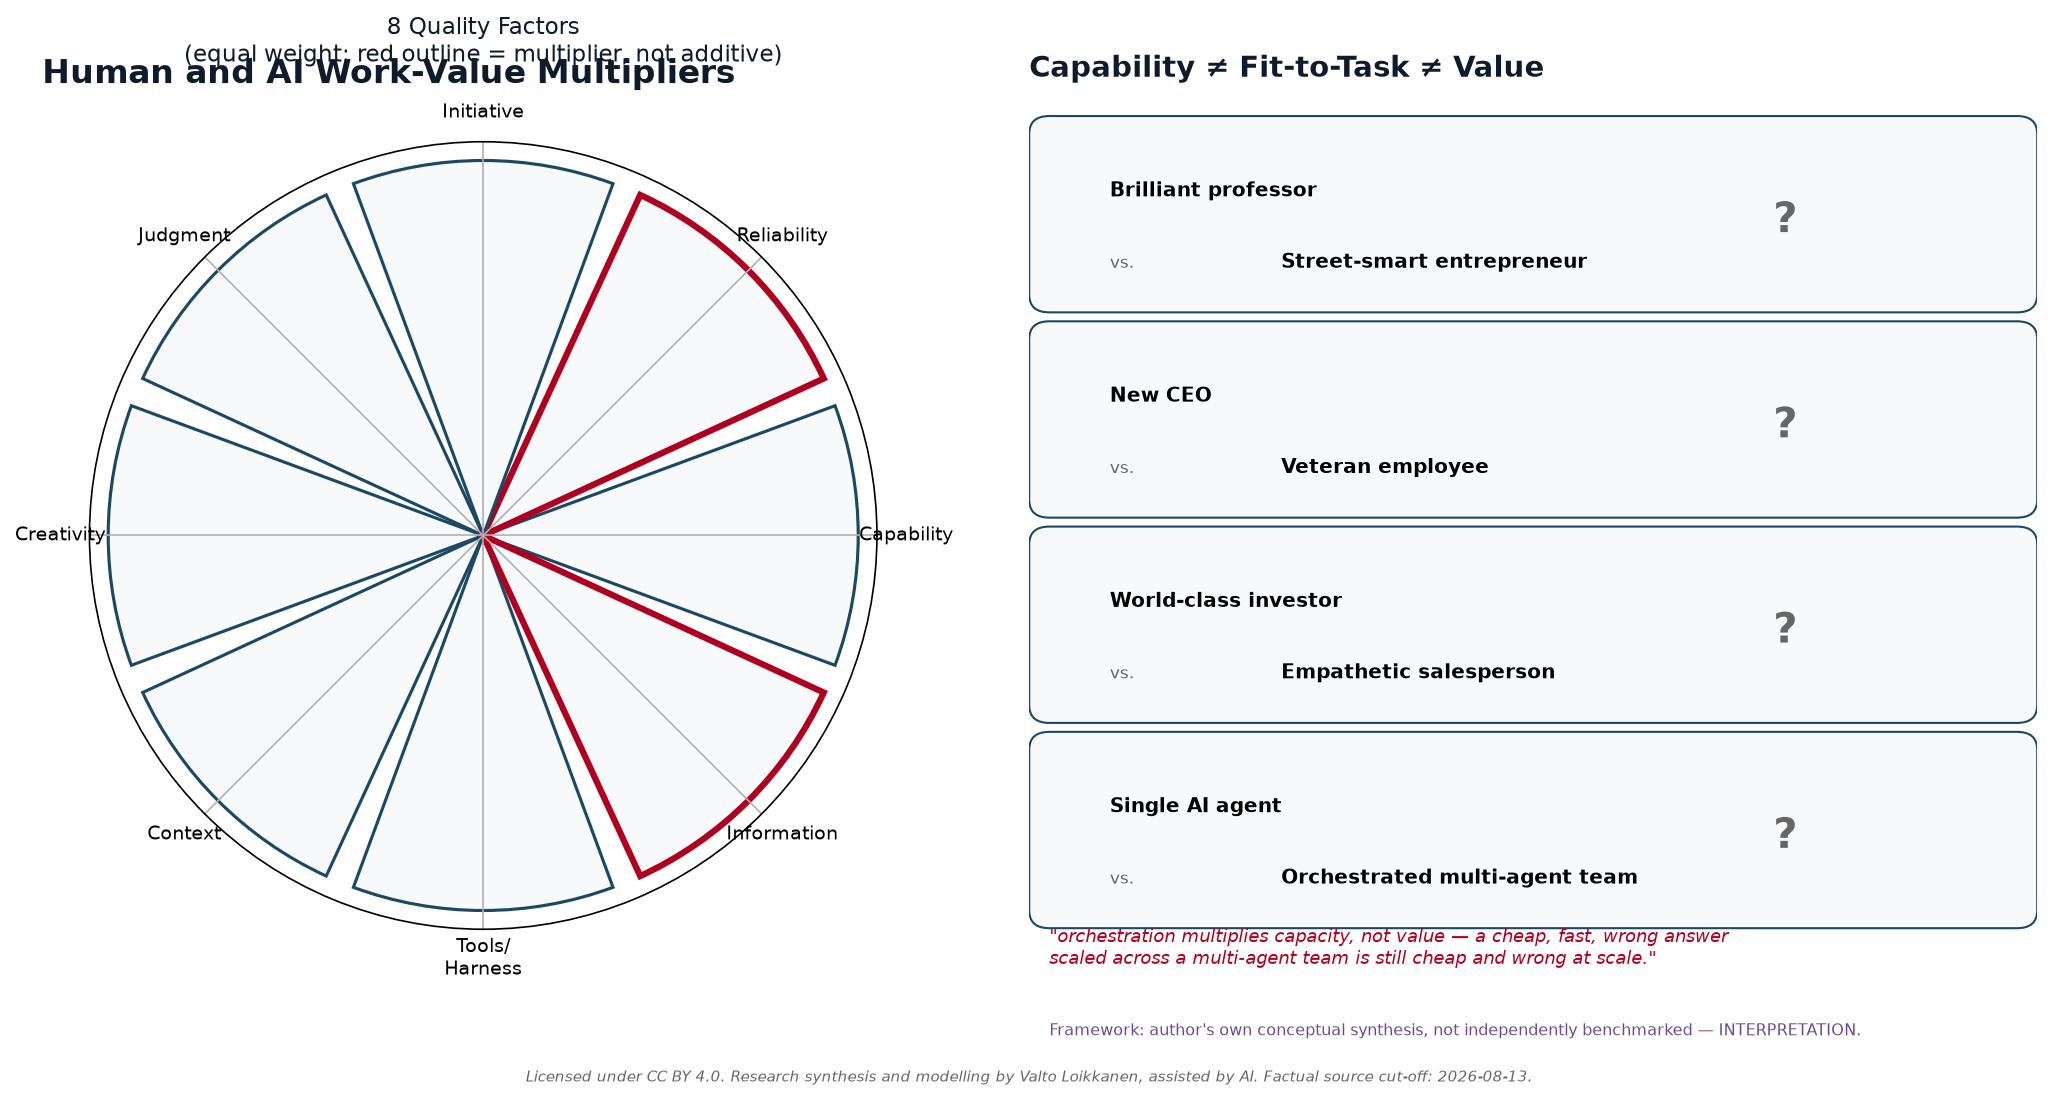
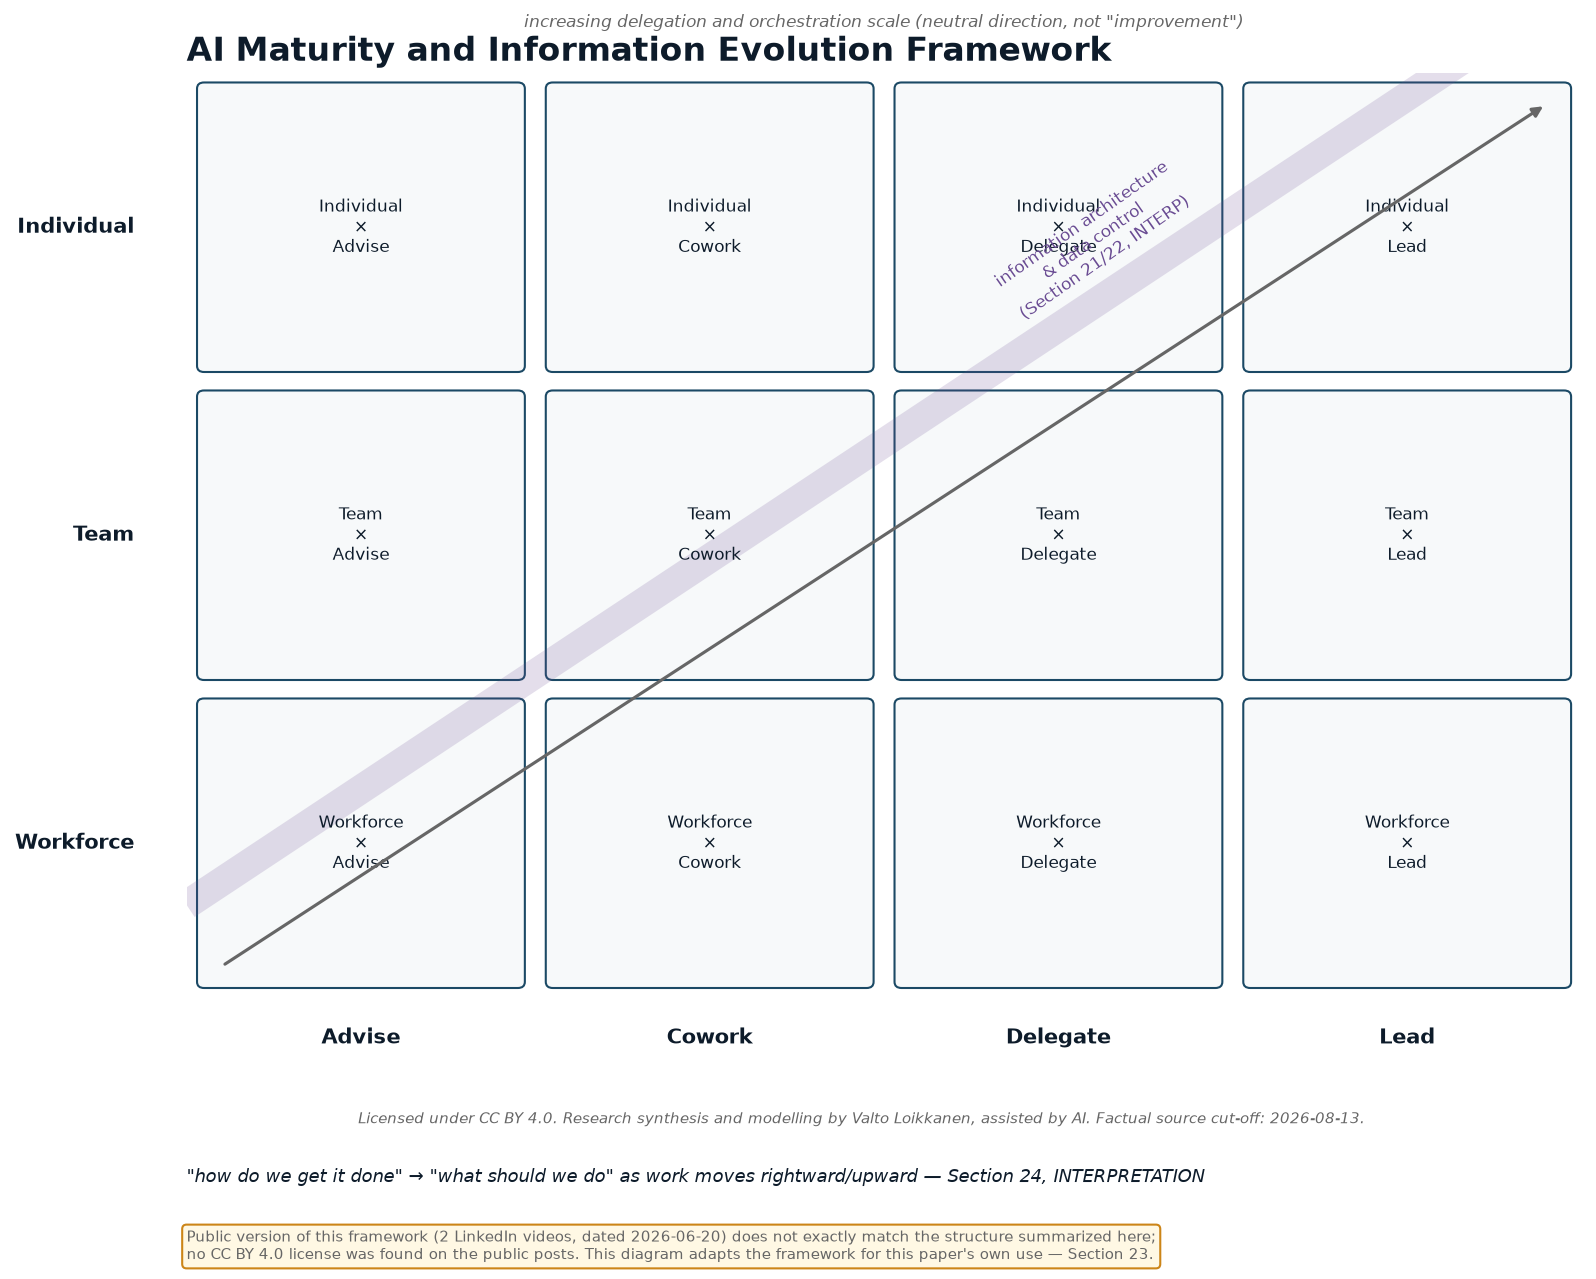
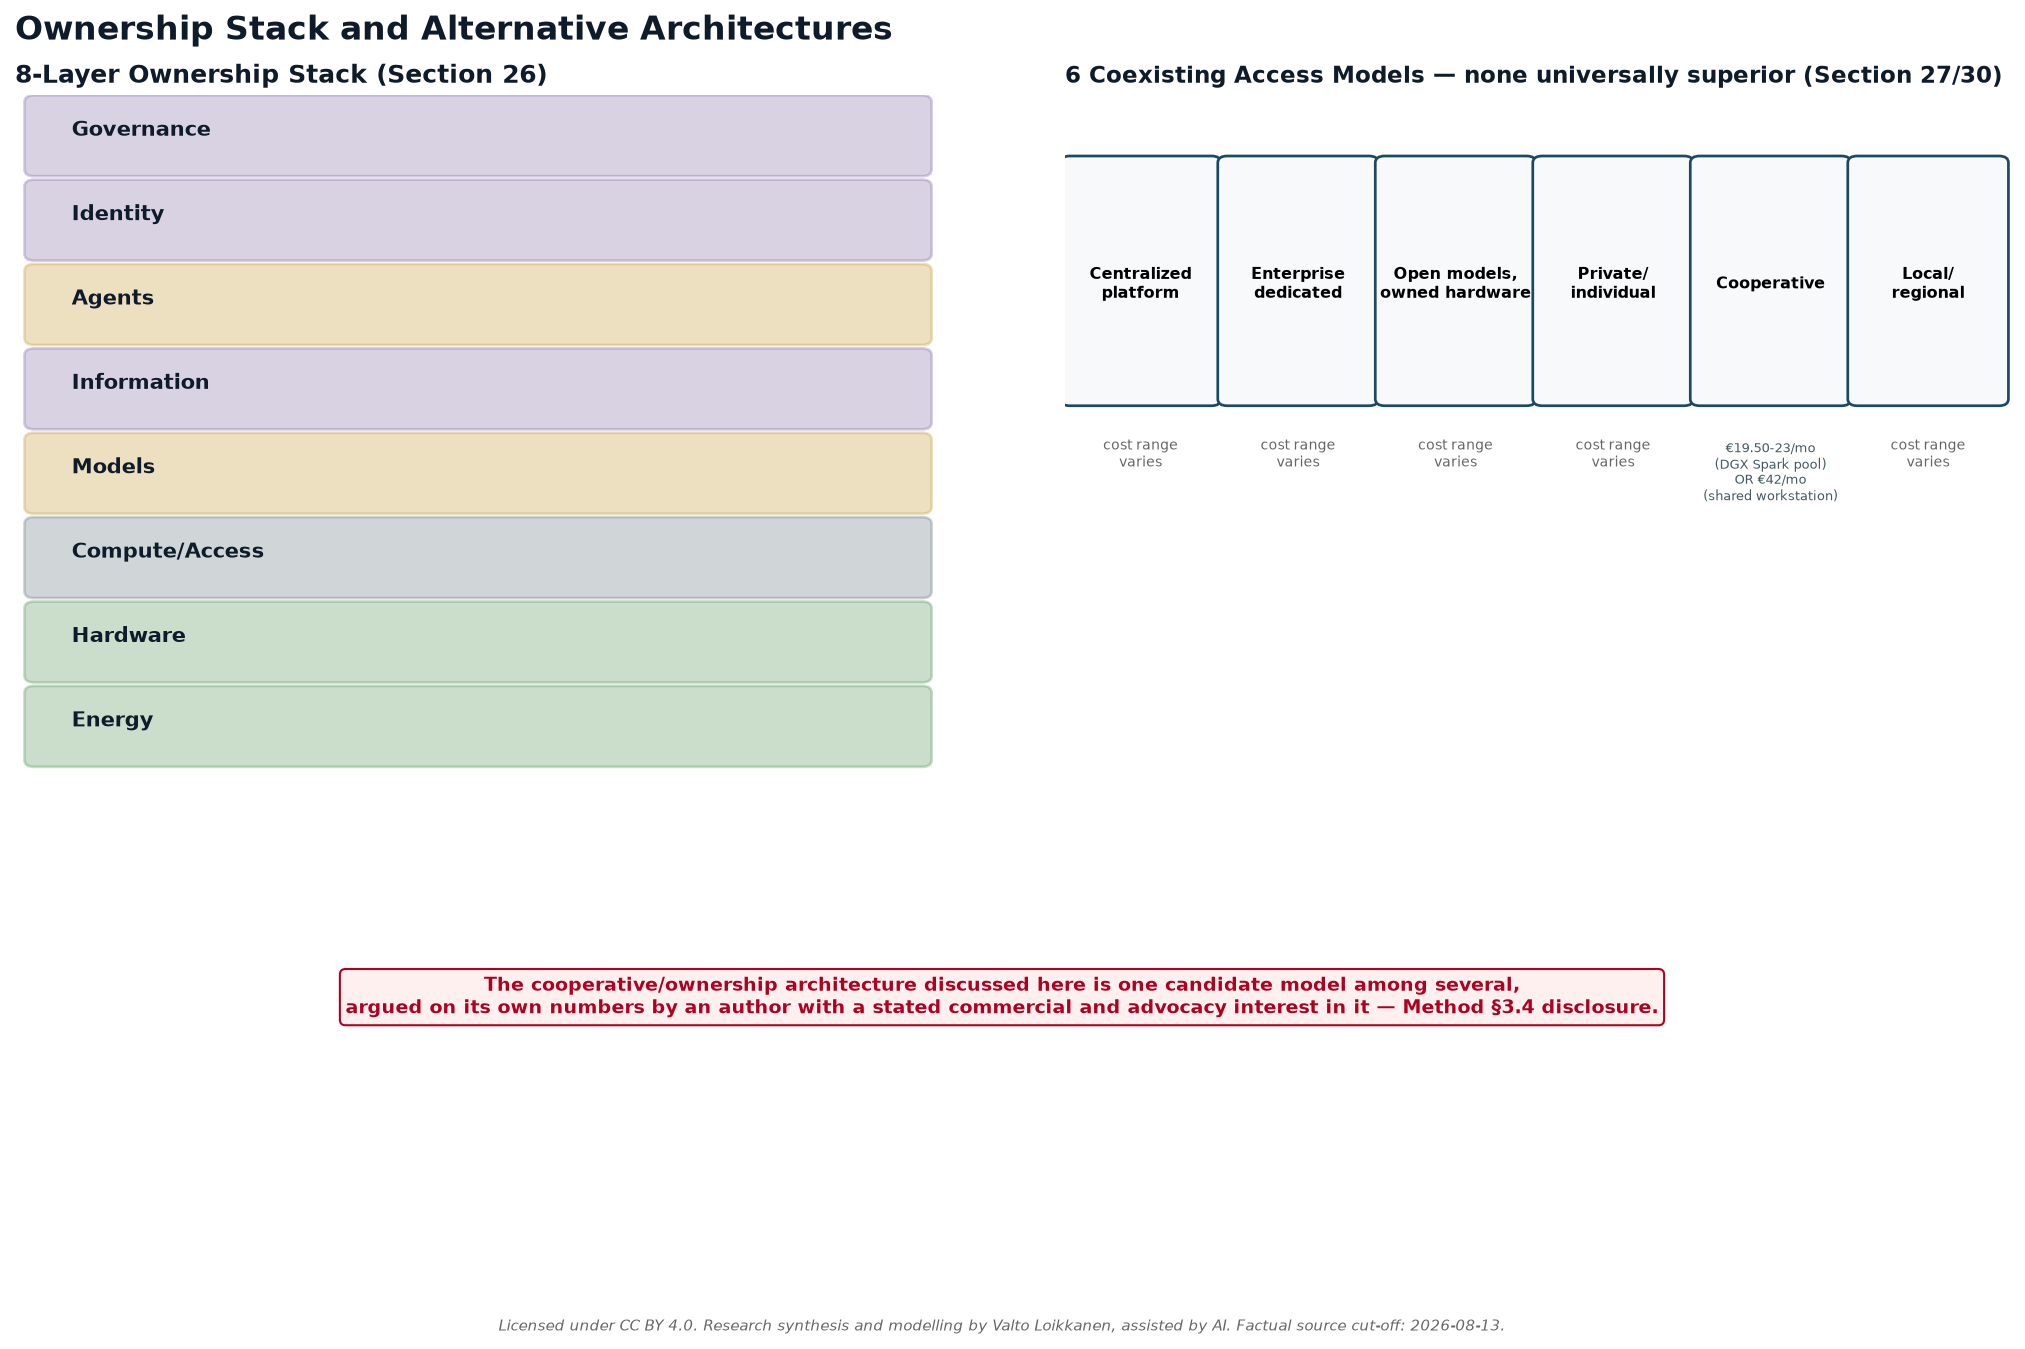
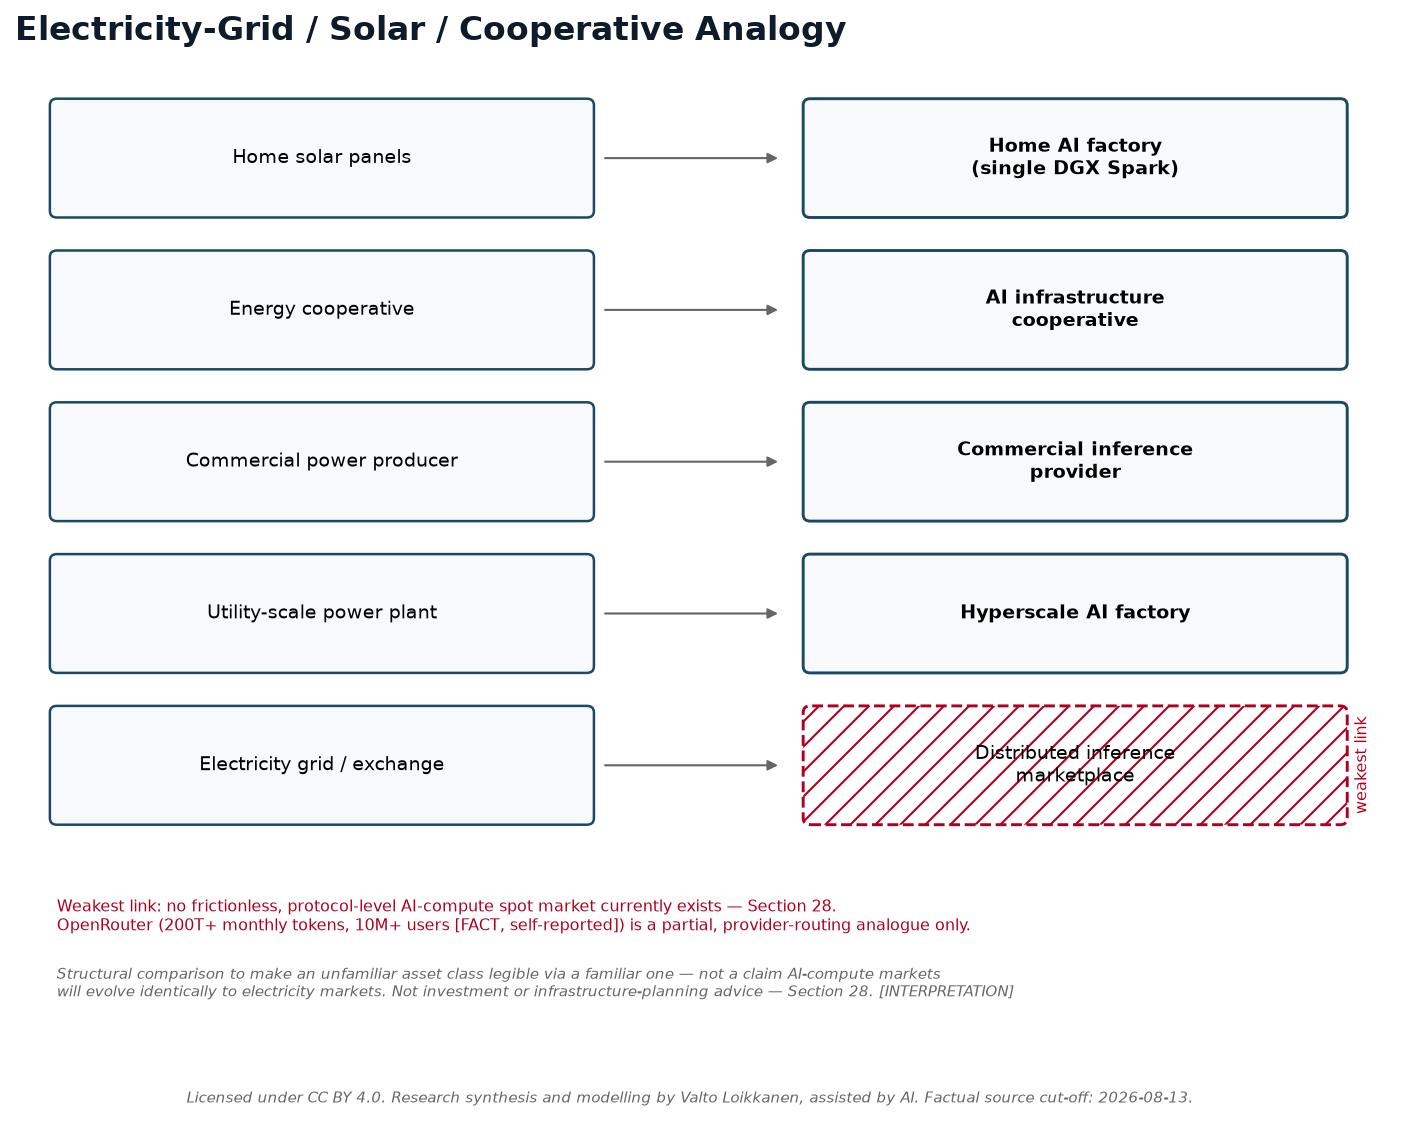
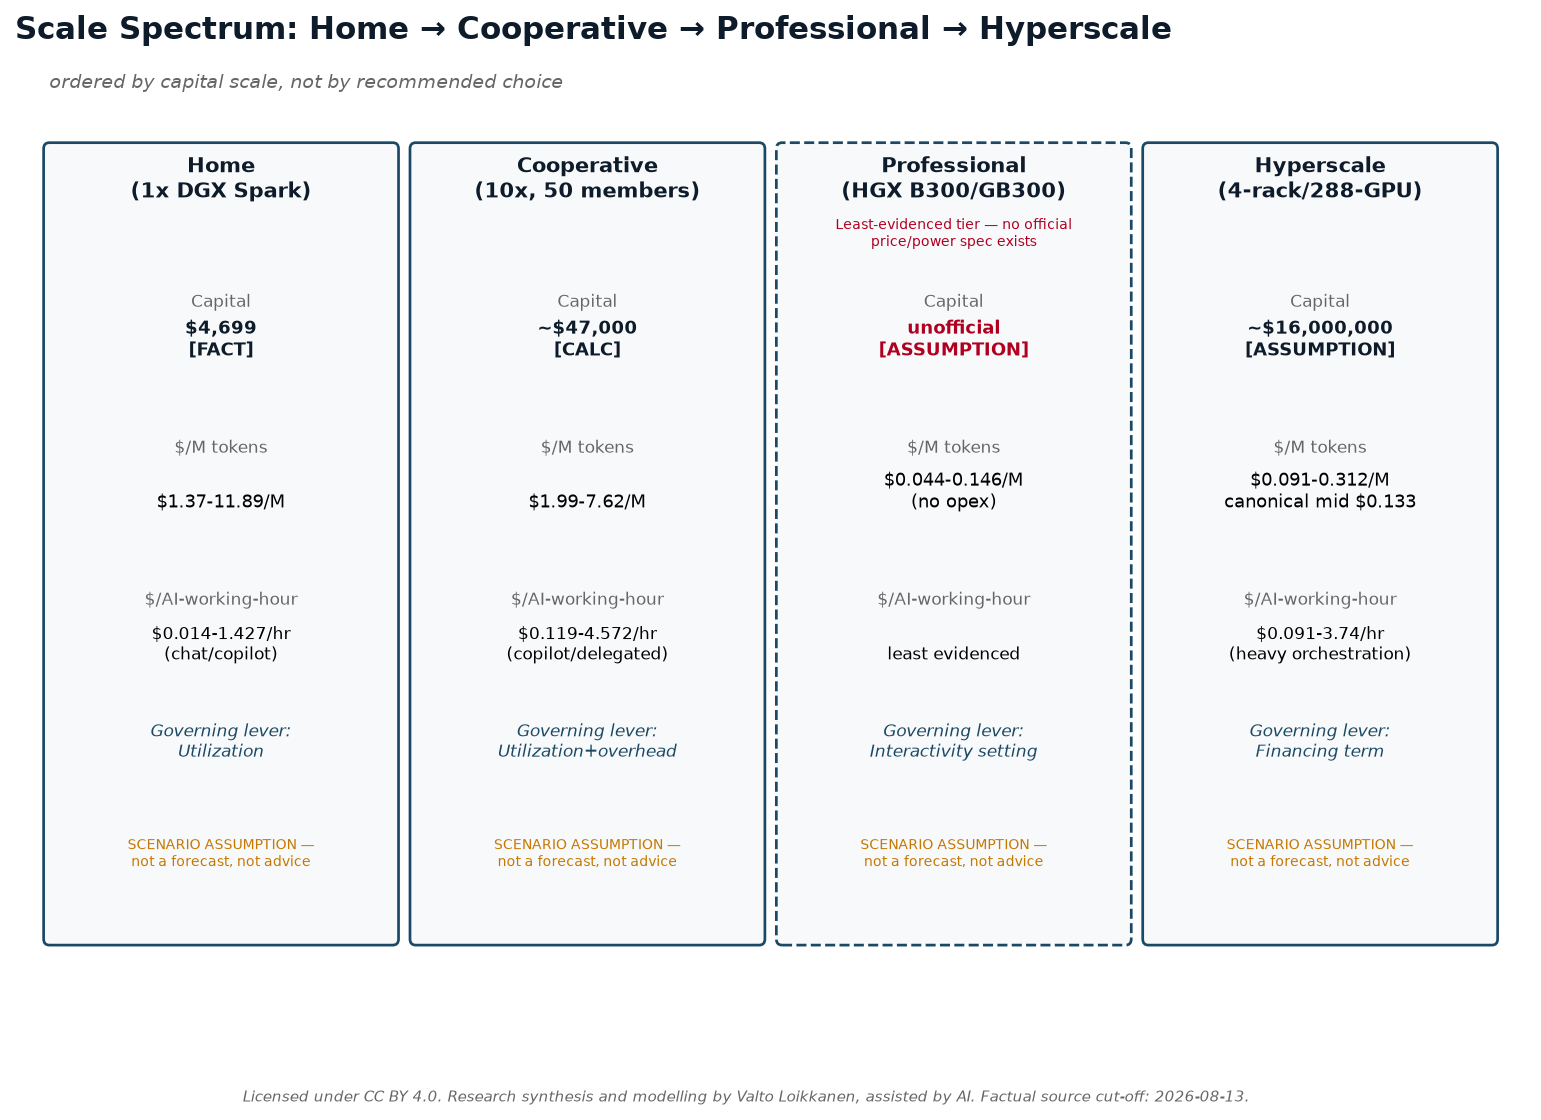
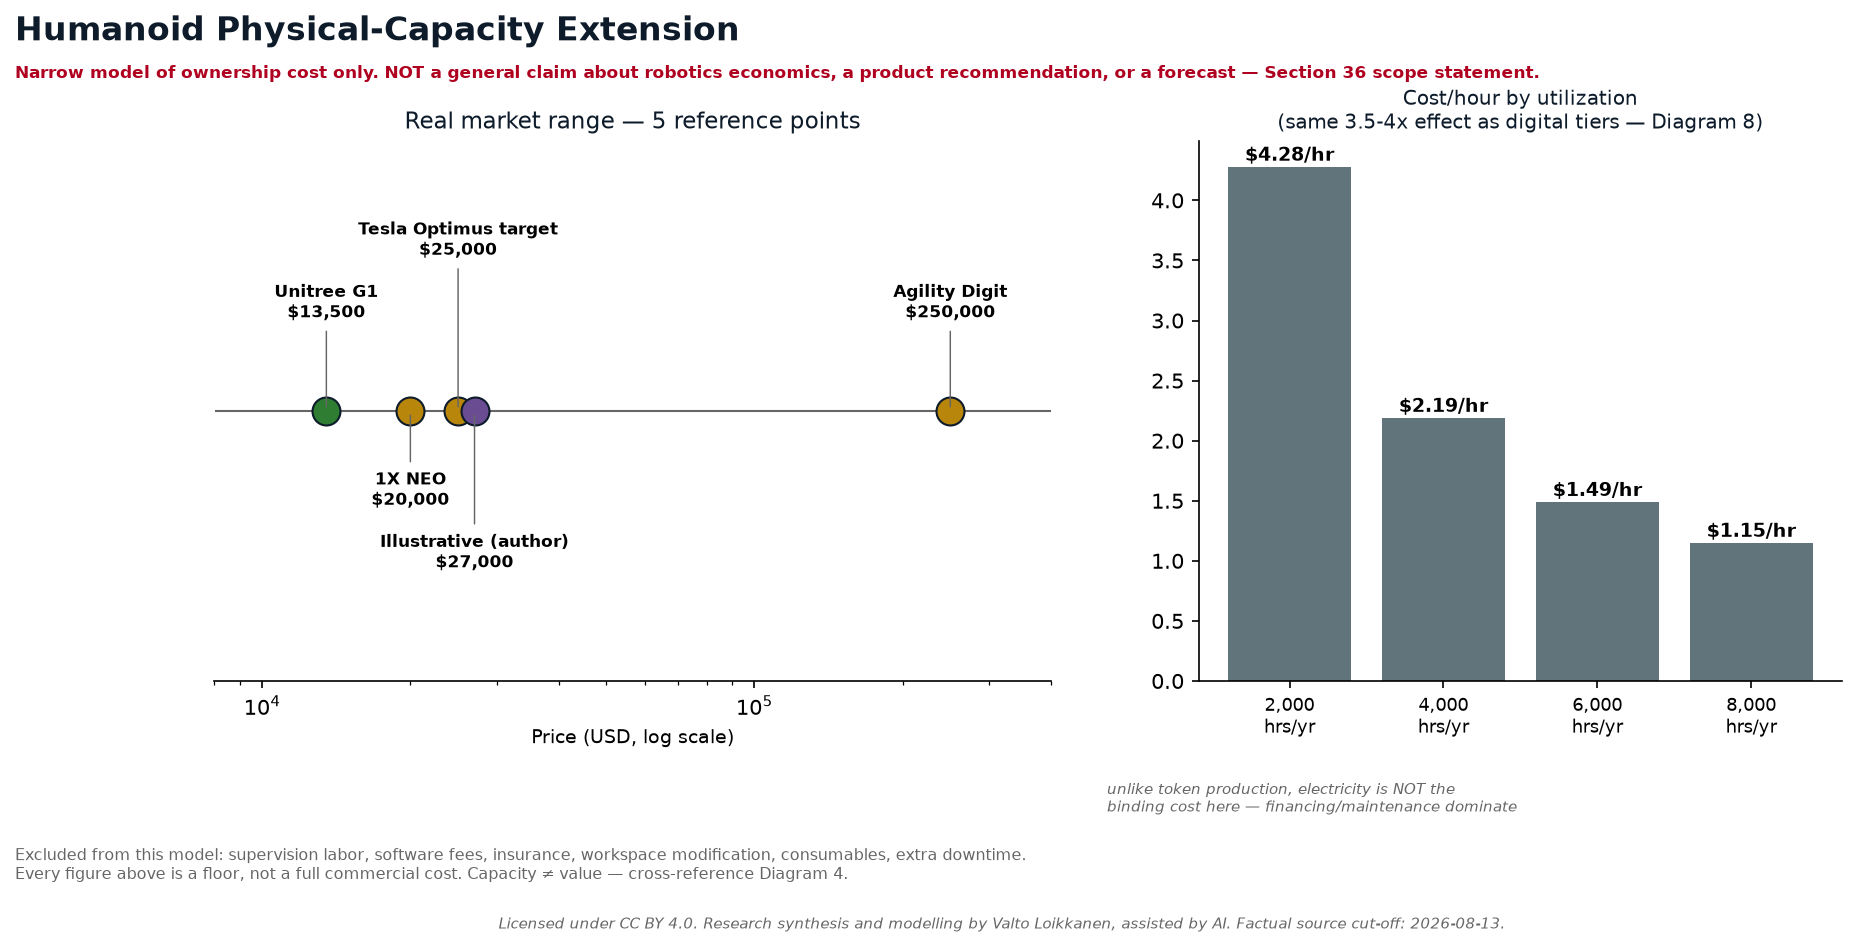
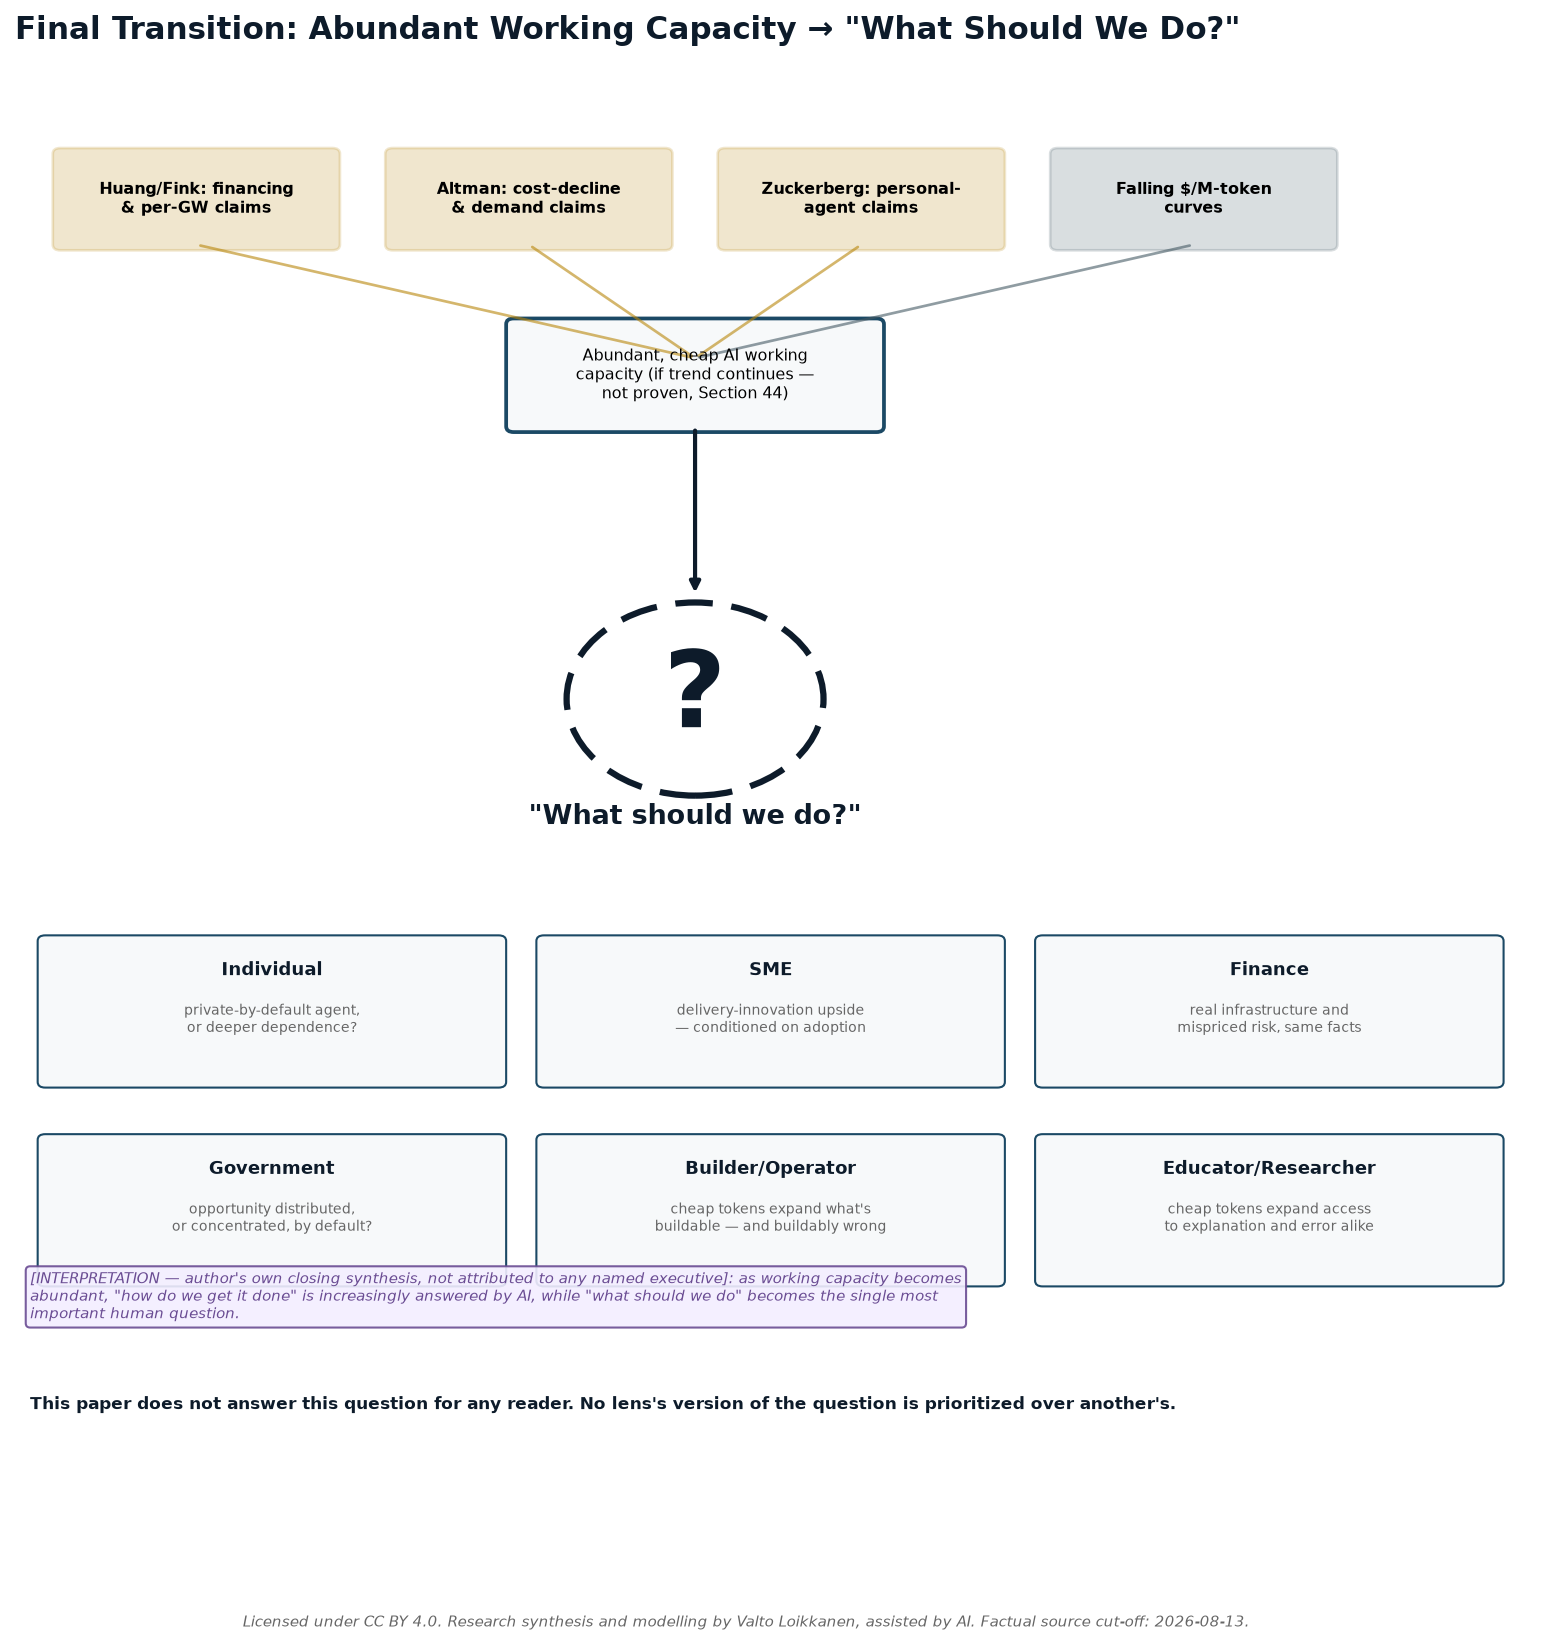
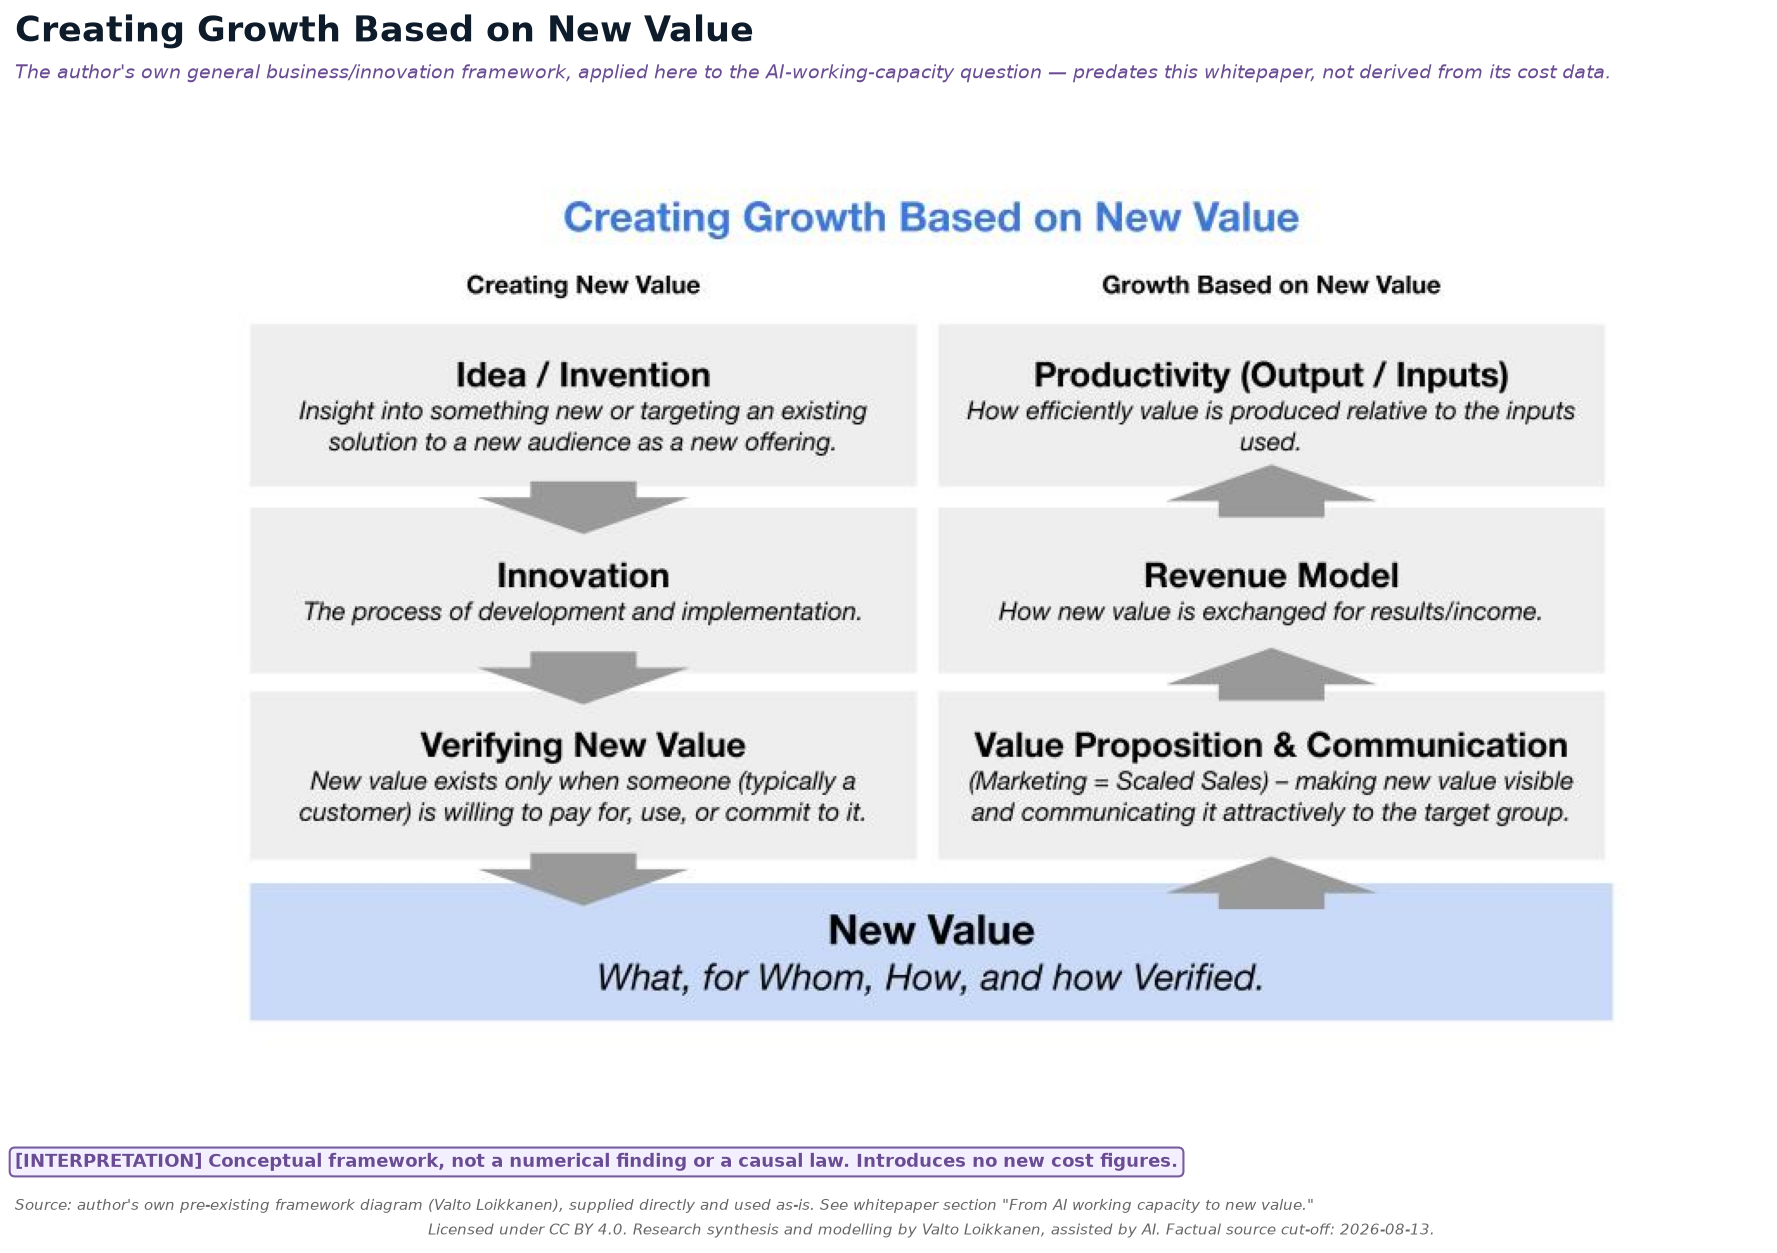
Diagram 1 — The End-to-End Working-Capacity Chain. Organizing framework, INTERPRETATION per Method §3.1.Diagram 2 — Energy-to-Token Stack and Cost Waterfall. Worked EUR example, Section 15.Diagram 3 — Token-to-Working-Capacity Intensity Ladder. Usage-intensity bands and cross-tier cost matrix, Sections 16-17.Diagram 4 — Human and AI Work-Value Multipliers. Capability ≠ fit-to-task ≠ value, Section 18-19.Diagram 5 — AI Maturity and Information Evolution Framework. Author's own adapted framework, Section 23, INTERPRETATION.Diagram 6 — Ownership Stack and Alternative Architectures. Sections 26-27/30.Diagram 7 — Electricity-Grid / Solar / Cooperative Analogy. Section 28, INTERPRETATION.Diagram 8 — Scale Spectrum: Home → Cooperative → Professional → Hyperscale. Section 35.Diagram 9 — Humanoid Physical-Capacity Extension. Section 36, narrow ownership-cost model only.Diagram 10 — Final Transition: Abundant Working Capacity → "What Should We Do?" Sections 43-45.Diagram 11 — Creating Growth Based on New Value. The author's own pre-existing framework diagram, supplied and used as-is; see the "From AI working capacity to new value" section of the whitepaper.